

Wind resource maps are one of the most commonly used tools in all parts of the wind industry. Different versions have been produced by federal and state government agencies, wind organizations, and private companies. These maps are an excellent starting point for those who are considering small wind projects, as they provide a broad brush look at the wind resource in different portions of the country.
 No matter who is producing them, these maps are all constructed using the same basic techniques. The general process is to run a weather computer model in a backward looking mode (instead of the forward-looking mode that most weather models are designed for) for an extended period, usually 10 to 15 years. That data is then compared to real world weather conditions that were observed during the same period, and the computer model results are adjusted to account for those real world observations. Then the adjusted computer model results are summarized statistically and the wind resource maps are created and published.
These methods are very powerful (and are similar to some of the steps of smallwind.com's WindCheck analysis). However, they do have several significant limitations:
- Even though the computer models used to generate these maps can be run at a relatively high horizontal resolution (some are run at 5 km resolution, which is state-of-the-art for a model that covers the entire country), they still cannot capture many of the geographic and topographic features that affect the wind at a location. More importantly, they do not (and probably never will) capture any of the site-specific features (buildings, trees, etc) that further define the wind resource at a particular location.
 - These maps can only depict the average wind speeds and therefore don't provide information on the variability of the wind. The winds don't always blow at the average speed, and it is important for the small wind owner to understand that the wind in any particular day, month, or year can be much lower (or much higher) than the average, with economic impacts that need to be accounted for.
- Because they were first developed for the utility-scale wind industry, many of these maps are for heights above the ground (traditionally 50 meters, and now up to 80 meters) that are not practical for small wind installations. In general, winds increase with height, so using a 50 or 80 meter map may overestimate the wind resource available to a small wind system at a lower height.
- Finally, the 10 or 15 year time periods used to generate these maps may not capture all of the year to year variation that is present in the atmosphere. Medium and Long-term patterns like El Nino and other planetary scale oscillations can result in signficant changes in the wind speed at any location on the globe, and they may not be captured sufficiently in a 10 or even a 15 year data sample.
Our WindCheck products have been designed specifically to overcome these limitations, which are also found in other wind resource assessment products generated with similar techniques. Nonetheless, with an understanding of those limitations, wind resource maps can still provide useful information. The most commonly used maps are those produced for the Department of Energy's National Renewable Energy Laboratory (NREL). These include a national map and maps for approximately 30 states:
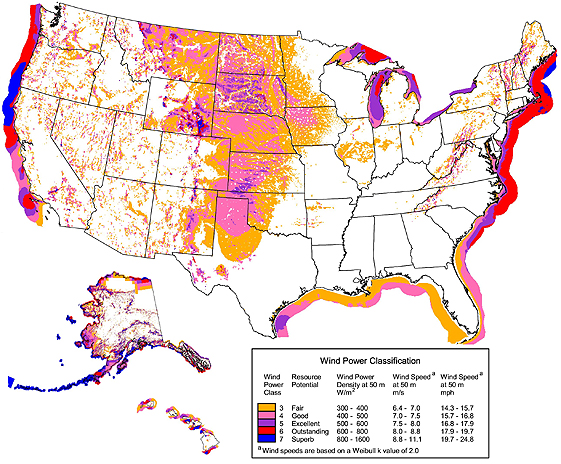
Individual state wind resource maps are available for the following states:
| AK | AZ | AR | CA | CO | CT | DE | GA* | HI | IA** |
| ID | IL | IN | KS | KY | MA | MD | ME | MI | MN** |
| MO | MT | NC | ND | NE | NH | NJ | NM | NV | NY* |
| OH | OK | OR | PA | PR/VI | RI | SC* | SD | TN | TX** |
| UT | VA | VT | WA | WI* | WV | WY |
* indicates NREL maps that have not yet been validated
** indicates non-NREL state maps